Contents
Scroll to:
https://doi.org/10.37489/2588-0527-0007
EDN: YJAYFO
Scroll to:
Background. The therapeutic response to ACE inhibitors in hypertension is variable and depends on a combination of clinical, behavioral, and pharmacogenetic factors. Mathematical modeling allows us to assess their contribution to achieving the target values of blood pressure.
Objective. To determine the factors associated with the achievement and non-achievement of target blood pressure values in patients with arterial hypertension receiving ACE inhibitors in monotherapy.
Materials and methods. A single-center observational pharmacogenetic study was conducted in the period from February to May 2025. Comparison groups were formed to achieve the target blood pressure values: <140/90 mmHg and ≥140/90 mmHg. The pharmacogenetic profile of patients was assessed by the presence/absence of polymorphisms of the ACE I/D (rs1799752) and CES1 (c.1168-33C>A). The outcomes of therapy were considered to be the achievement of target values of BP, ΔSAD, and ΔDAD. The following parameters were selected as the studied confounders of the regression model: the number of polymorphic D alleles in the gene ACE; the number of polymorphic C alleles in the gene CES1, age, the amount of salt consumed per day, the number of cigarettes smoked per day.
Results. The study included 90 patients of whom: 39 reached the target blood pressure values (43.3%), and 59 did not (56.7%). An increase in the number of ACE D-alleles was associated with an increase in SBP after therapy by 23.5 mmHg (95% CI: 20.68-26.41, p <0.001), DBP by 4.67 mmHg (95% CI: 3.59-5.94, p <0.001). An increase in salt intake by 1 g/day was accompanied by an increase in SBP by 0.54 mmHg (p=0.024), DBP – by 0.20 mmHg (p=0.041). Mathematical models explained 75.7% of SAD variability and 43.9% of DBP. The AUC of the logistic model was 0.97.
Conclusion. The number of polymorphic D alleles is associated with a therapeutic response and can be considered as a preliminary marker of ACE inhibitor efficacy (p<0.001).
Komarova O.V., Kantemirova B.I., Romanova A.N., Petrova O.V. Pharmacogenetics and mathematical modeling: approaches to individual prediction of response to ACE inhibitor therapy. Pharmacogenetics and Pharmacogenomics. 2026;(2):12-23. (In Russ.) https://doi.org/10.37489/2588-0527-0007. EDN: YJAYFO
Introduction
Arterial hypertension (AH) remains one of the leading medical and social problems because of its high prevalence among the working‑age adult population and its role as a major modifiable risk factor for cardiovascular diseases (CVD) and vasorenal complications [1]. To manage acute BP elevations and/or for long‑term treatment of AH, angiotensin‑converting enzyme inhibitors (ACEIs) are prescribed either as monotherapy or in combination [2]. The variability in response to ACEIs can be attributed to a complex of factors, including clinical and pharmacogenetic parameters [3–4]. Clinical factors include the correctness of diagnosis, the rationale for the chosen therapy, clinically significant drug interactions, comorbidity, and individual patient characteristics causing intolerance to the active or auxiliary components of the drugs. Polymorphic variants of genes involved in the renin‑angiotensin‑aldosterone system (RAAS) function and ACEI metabolism may be associated with differences in the magnitude of the antihypertensive effect [5]. The ACE I/D polymorphism (rs1799752) is considered one of the clinically relevant genetic factors that potentially affect ACE activity and vascular tone regulation [6]. Variants of the CES1 gene (c.1168‑33C>A), which participates in the metabolism of certain ACEIs, also influence the therapeutic response [5, 7–9].
In most cases, the therapeutic outcome in terms of individual sensitivity to antihypertensive therapy is influenced by the integration of clinical and pharmacogenetic patterns. Nowadays, pharmacogenetic approaches in cardiology have become practical, allowing, on the basis of evidence‑based medicine, the individualisation of drug choice, thereby significantly improving efficacy and safety [10]. However, the question of a direct association between RAAS gene polymorphisms and ACEI efficacy remains controversial because of the high heterogeneity of results from clinical studies, which require justification using mathematical modelling methods.
Objective
To determine the clinical and pharmacogenetic factors associated with achieving and not achieving target BP values in patients with arterial hypertension receiving ACEIs, using mathematical modelling techniques.
Materials and Methods
A single‑centre observational pharmacogenetic cohort study was conducted to evaluate the feasibility of using mathematical modelling to assess the impact of modifiable (BMI, smoking, salt intake) and non‑modifiable (age, ACE I/D (rs1799752), CES1 (c.1168‑33C>A)) confounders on the effectiveness of ACEI therapy. At the time of the study (February–May 2025), the enrolled patients were receiving outpatient care in the cardiology department of the Federal Centre for Cardiovascular Surgery (Astrakhan, Russian Federation). From outpatient records, 118 patients meeting the following inclusion criteria were selected: age ≥18 years; history of arterial hypertension; an alternative cardiological diagnosis accompanied by elevated BP; and ACEI monotherapy for at least 4 weeks. Exclusion criteria were defined before patient selection: use of other antihypertensive drug classes; concomitant use of drugs that raise BP (NSAIDs, systemic corticosteroids, erythropoietin preparations, hormonal contraceptives, sympathomimetics, and antidepressants). The study was approved by the local ethics committee of Astrakhan State Medical University (protocol No. 11 dated 25 December 2024). Participation was voluntary and ensured strict confidentiality of the obtained data and results.
The primary endpoint was the achievement/non‑achievement of target BP values while on ACEI monotherapy. Depending on the therapeutic response, patients were divided into two groups: those who achieved target BP (optimal therapeutic response, <140/90 mmHg) and those who did not (non‑optimal response, ≥140/90 mmHg). BP measurements were performed by a healthcare professional according to clinical guidelines in a healthcare facility using a mechanical sphygmomanometer (B. Well MED‑61, registration No. RD‑62688/24203 dated 07.05.2024). Control BP measurements were taken before treatment and after 4 weeks of ACEI therapy. Participants received the following ACEIs at maximum daily doses: perindopril (8 mg once daily); enalapril (20 mg twice daily); ramipril (10 mg once daily); fosinopril (20 mg twice daily). Therapy was prescribed by the attending physician as part of routine clinical practice. The study did not involve randomisation or changes to the treatment regimen. Secondary endpoints were SBP and DBP values after ACEI intake, as well as the changes in SBP (ΔSBP) and DBP (ΔDBP) relative to baseline. Clinical, anamnestic, and instrumental data were extracted from outpatient records. Data on daily salt consumption and number of cigarettes smoked were obtained via patient questionnaires.
Pharmacogenetic analysis was performed on venous blood samples collected into EDTA tubes during routine biochemical blood testing. Genomic DNA was extracted using a magnetic‑particle‑based kit “M‑Sorb‑Blood” (No. HG‑502‑100). Genotyping for ACE and CES1 polymorphisms was carried out by allele‑specific real‑time PCR on a CFX96 Touch Real‑Time PCR Detection System (Bio‑Rad Laboratories, Inc., USA). The following reagent kits were used: “Alu I/D of the ACE gene (rs4646994)” (NP‑519‑100) and “GeneTest CES1 c.1168‑33C>A (rs2244613)”. Genotype frequencies were checked for Hardy–Weinberg equilibrium. Based on the detected polymorphisms, patients were classified as carriers of the following ACE genotypes: II, ID, DD; and CES1 genotypes: AA, AC, CC.
The authors assessed the potential use of several confounders as parameters of a mathematical model for evaluating ACEI efficacy. Data are presented as categorical and quantitative variables, for which the normality of distribution was additionally tested. Quantitative and qualitative characteristics of the overall sample were analysed using descriptive statistics. Differences in clinical parameters depending on achievement of target BP were assessed with Student’s t‑test. Changes in therapeutic response to ACEIs according to combined ACE/CES1 genotypes were evaluated using the Kruskal–Wallis test with Dunn’s post‑hoc test and Bonferroni correction. To identify factors associated with the therapeutic response to ACEIs, regression mathematical modelling was applied. Quantitative therapeutic response outcomes (SBP and DBP after ACEI therapy) were analysed using multiple linear regression. Binary logistic regression was used for the binary outcome, with calculation of adjusted and unadjusted odds ratios (OR, 95% CI). The significance of individual confounders was assessed with the Wald test. The proportion of variance explained by the models was estimated using Nagelkerke’s R². The significance level was set at p <0.05. Model quality was evaluated using ROC analysis with determination of the area under the curve (AUC), sensitivity, and specificity. To reduce the risk of overfitting, the number of tested confounders was limited according to the number of observations and the number of outcomes in the achievement/non‑achievement groups.
Results
The number of patients potentially meeting the inclusion criteria was determined from available outpatient records of hypertensive patients receiving ACEI monotherapy for 4 weeks. Ultimately, 90 patients with a complete set of clinical and pharmacogenetic data required for the study were selected. The study population was predominantly male (65.6%), of elderly age (65.8±10.1 years; 95% CI: 63.7–67.9), with class I obesity (30.2±5.8; 95% CI: 29.0–31.4). The sample initially had factors that could potentially hinder the achievement of target BP, including advanced age and elevated BMI, which were considered when interpreting the mathematical modelling results. Participants were divided into two groups: those who achieved target BP (<140/90 mmHg, n=39) and those who did not (≥140/90 mmHg, n=51). Comparison of clinical characteristics is presented in Table 1.
Table 1. Clinical characteristics of patients according to achievement of target BP values during ACE inhibitor therapy
| Clinical parameter | Overall sample (n=90) | Achieved target BP (<140/90 mmHg) (n=39) | Did not achieve target BP (≥140/90 mmHg) (n=51) | p |
|---|---|---|---|---|
| Age, complete years | 65.80±10.1 95% CI: 63.7–67.9 | 66.7±11.2 95% CI: 63.2–70.2 | 65.1±9.25 95% CI: 62.6–67.4 | 0.48 |
| BMI, kg/m² | 30.2±5.8 95% CI: 29.0–31.4 | 30.6±6.68 95% CI: 28.5–32.7 | 29.8±5.08 95% CI: 28.4–31.2 | 0.55 |
| SBP before ACEI therapy, mmHg | 164.2±20.1 95% CI: 160.1–168.3 | 146.5±8.04 95% CI: 143.9–149.0 | 177.7±15.3 95% CI: 173.5–181.9 | <0.001* |
| DBP before ACEI therapy, mmHg | 94.0±5.5 95% CI: 92.9–95.1 | 91.0±3.28 95% CI: 89.9–92.0 | 96.3±5.82 95% CI: 94.7–97.9 | <0.001* |
| SBP after ACEI therapy, mmHg | 146.6±20.3 95% CI: 142.4–150.8 | 125.9±7.24 95% CI: 123.6–128.2 | 162.4±10.2 95% CI: 159.6–165.2 | <0.001* |
| DBP after ACEI therapy, mmHg | 85.1±5.5 95% CI: 83.9–86.2 | 80.9±3.0 95% CI: 79.9–81.8 | 88.3±4.65 95% CI: 87.0–89.6 | <0.001* |
| ΔSBP, mmHg | 17.8±8.2 95% CI: 16.1–19.5 | 20.6±7.4 95% CI: 18.3–22.9 | 15.6±8.2 95% CI: 13.3–17.8 | 0.003* |
| ΔDBP, mmHg | 8.9±4.8 95% CI: 7.9–9.9 | 10.1±4.51 95% CI: 8.68–11.5 | 7.94±4.92 95% CI: 6.6–9.3 | 0.03* |
Notes: TBP – target blood pressure; * – statistically significant values; SBP – systolic blood pressure; DBP – diastolic blood pressure; ΔSBP – change in SBP during ACEI therapy; ΔDBP – change in DBP during ACEI therapy.
The groups of patients who achieved and did not achieve target BP were comparable in age and BMI but differed significantly in baseline and final SBP and DBP values (p <0.001). In terms of the dynamics of SBP and DBP changes after ACEI use, patients who reached target BP showed a more pronounced reduction in both SBP and DBP (p=0.003 and p=0.03, respectively).
Given the observed differences in haemodynamic parameters between the groups, a pharmacogenetic assessment of the influence of RAAS polymorphisms (ACE I/D (rs1799752), CES1 (c.1168‑33C>A)) on the therapeutic response to ACEIs was performed. The genotype distributions for both polymorphisms were consistent with Hardy–Weinberg equilibrium (p>0.05). The results of the polymorphism effect on therapeutic response are presented in Table 2.
Table 2. Therapeutic response to ACE inhibitor therapy according to the combined pharmacogenetic profile of ACE and CES1
| Clinical parameter | 1. ACE (II) + CES1 (AA) | 2. ACE (ID+DD) + CES1 (AA) | 3. ACE (II) + CES1 (AC+CC) | 4. ACE (ID+DD) + CES1 (AC+CC) | p |
|---|---|---|---|---|---|
| n (%) | 19 (21.1%) | 25 (27.8%) | 16 (17.8%) | 30 (33.3%) | |
| SBP before ACEI therapy, mmHg | 145.0 [140.0–150.0] | 175.0 [160.0–190.0] | 145.0 [140.0–150.0] | 172.50 [165.0–190.0] | <0.001* p1‑2<0.001* p1‑4<0.001* p2‑3<0.001* p3‑4<0.001* |
| DBP before ACEI therapy, mmHg | 90.0 [90.0–90.0] | 95.0 [90.0–100.0] | 90.0 [90.0–95.0] | 95.0 [95.0–100.0] | <0.001* p1‑2=0.004* p1‑4<0.001* p3‑4=0.014* |
| SBP after ACEI therapy, mmHg | 125.0 [120.0–135.0] | 160.0 [150.0–170.0] | 125.0 [120.0–130.0] | 160.0 [151.20–170.0] | <0.001* p1‑2<0.001* p1‑4<0.001* p2‑3<0.001* p3‑4<0.001* |
| DBP after ACEI therapy, mmHg | 80.0 [80.0–85.0] | 85.0 [80.0–90.0] | 80.0 [80.0–80.0] | 90.0 [90.0–90.0] | <0.001* p1‑2=0.013* p1‑4<0.001* p2‑3<0.001* p3‑4<0.001* |
| ΔSBP, mmHg | 15.0 [15.0–22.50] | 15.0 [10.0–20.0] | 20.0 [20.0–26.20] | 15.0 [10.0–20.0] | 0.018* p2‑3=0.023* p3‑4=0.039* |
| ΔDBP, mmHg | 5.0 [5.0–10.0] | 5.0 [5.0–10.0] | 10.0 [10.0–15.0] | 5.0 [5.0–10.0] | 0.005* p2‑3=0.014* p3‑4=0.005* |
Notes: ACE (II) – wild‑type genotype of a healthy patient; ACE (ID+DD) – combination of heterozygous and homozygous genotypes with the polymorphic D allele of the ACE I/D gene (rs1799752); CES1 (AA) – wild‑type genotype of a healthy patient; CES1 (AC+CC) – combination of heterozygous and homozygous genotypes with the polymorphic C allele of the CES1 gene (c.1168‑33C>A); * – statistically significant p‑values.
Comparative analysis showed statistically significant differences between combined pharmacogenetic profiles (ACE I/D (rs1799752), CES1 (c.1168‑33C>A)) in terms of post‑treatment SBP and DBP values, as well as ΔSBP and ΔDBP. Higher BP values were observed predominantly in carriers of the ACE I/D (rs1799752) polymorphic D allele, regardless of the CES1 (c.1168‑33C>A) genotype. The greatest BP reduction was observed in patients with ACE (II) + CES1 (AC+CC) genotypes (p=0.018).
Given the limited number of patients meeting the inclusion criteria, the number of independent variables in the regression models was restricted. The following confounders were included in the analysis: number of polymorphic D alleles in the ACE I/D (rs1799752) gene; number of polymorphic C alleles in the CES1 (c.1168‑33C>A) gene; age; daily salt intake; and number of cigarettes smoked per day.
The association of SBP and DBP with various confounders was assessed using multiple linear regression (variable elimination method).
The resulting model for SBP was described by the equation:
YSBP = 137.44 + 23.5 ∙ XD + 0.54 ∙ XSALT – 0.2 ∙ XAGE
where YSBP – SBP after ACEI therapy, mmHg; XD – number of polymorphic D alleles of the ACE I/D (rs1799752) gene; XSALT – daily salt intake, grams; XAGE – patient age, complete years.
An increase in the number of polymorphic D alleles by 1 was associated with a 23.5 mmHg increase in SBP (95% CI: 20.68–26.41; p <0.001); each 1 g/day increase in salt intake was associated with a 0.54 mmHg increase in SBP (95% CI: 0.07–1.01; p=0.024); and a 1‑year increase in age led to a 0.2 mmHg decrease in SBP (95% CI: –0.41, –0.1; p=0.04) (with other factors held constant).
The regression model had a correlation coefficient rxy = 0.87, indicating a strong relationship according to the Chaddock scale. The model was significant at p <0.001. The coefficient of determination showed that the included factors explained 75.7% of the variance in post‑treatment SBP among genotyped patients. Age and daily salt intake were considered clinically relevant factors associated with SBP level, whereas the number of D alleles of the ACE I/D (rs1799752) gene was included to assess the pharmacogenetic contribution to the variability of the response to ACEI therapy.
The result of the mathematical model for the dependence of SBP on the number of ACE I/D (rs1799752) D alleles is shown in the scatter plot of pairwise linear regression in Fig. 1.
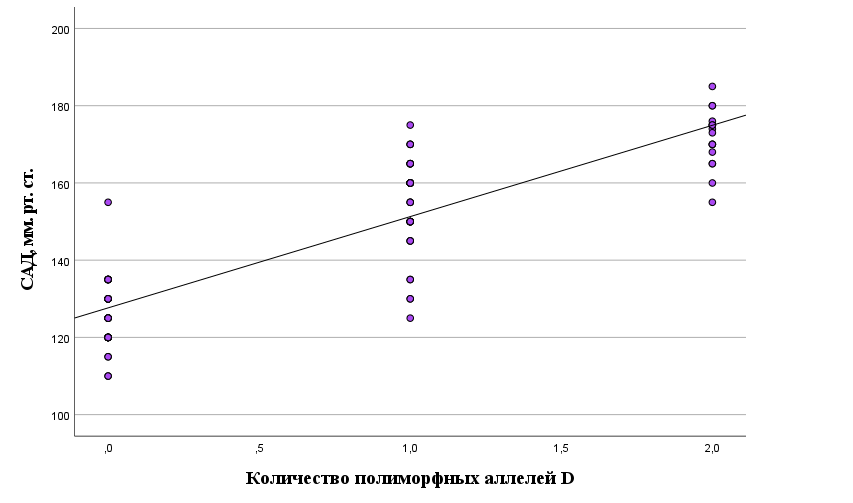
Fig. 1. Dependence of SBP on the number of polymorphic D alleles of the ACE I/D gene (rs1799752)
A similar mathematical model was constructed for DBP values after ACEI intake. The observed dependence for DBP was described by the equation:
YDBP = 80.2 + 4.67 ∙ XD + 0.2 ∙ XSALT
where YDBP – DBP after ACEI therapy, mmHg; XD – number of polymorphic D alleles of the ACE I/D (rs1799752) gene; XSALT – daily salt intake, grams.
An increase in the number of polymorphic D alleles by 1 was associated with a 4.67 mmHg increase in DBP (95% CI: 3.59–5.94; p <0.001); each 1 g/day increase in salt intake resulted in a 0.2 mmHg increase in DBP (95% CI: 0.009–0.394; p=0.041) (with other factors held constant). This regression model had a correlation coefficient rxy = 0.67, indicating a moderate relationship according to the Chaddock scale. The model was significant at p <0.001. The coefficient of determination indicated that the included factors explained 43.9% of the variance in DBP among genotyped patients. The result of the mathematical model for DBP versus the number of ACE I/D (rs1799752) D alleles is shown in Fig. 2.
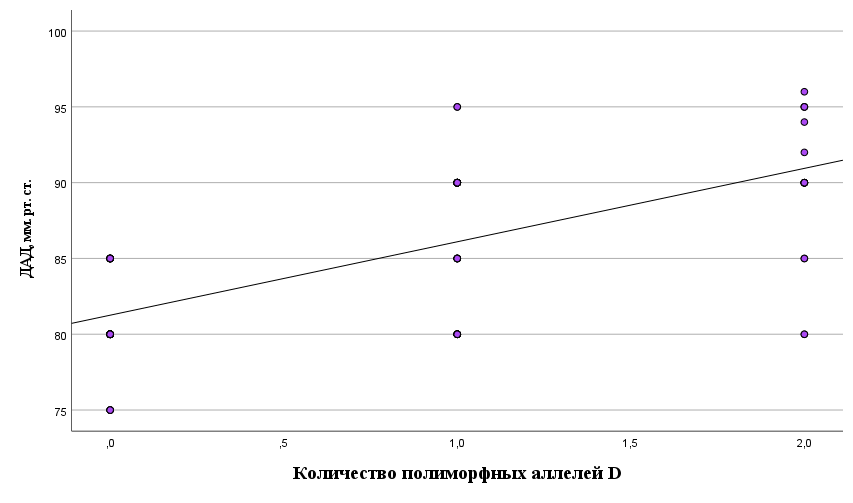
Fig. 2. Dependence of DBP on the number of polymorphic D alleles of the ACE I/D gene (rs1799752)
A mathematical model for predicting the probability of not achieving target BP was developed using binary logistic regression. The observed relationship is described by the equation:
P = 1 / (1 + e–z) ∙ 100%
z = 2.98 + 6.53 ∙ XD – 0.11 ∙ XAGE
where P – probability of not achieving target BP (%); XD – number of polymorphic D alleles of the ACE I/D (rs1799752) gene; XAGE – patient age, complete years.
The logistic regression model was statistically significant (p <0.001). According to Nagelkerke’s R², 84.5% of the variance in the probability of not achieving target BP after ACEI intake was determined by the factors included in the model.
As shown in the table, an increase in the number of polymorphic alleles by 1 was associated with a 6.53‑fold increase in the odds of not achieving target BP, while a 1‑year increase in age reduced the odds by 0.11‑fold (with other factors held constant).
Based on the regression coefficients, the number of polymorphic D alleles in the genotype had a direct relationship with non‑achievement of target BP, whereas age showed an inverse relationship. The characteristics of each factor are presented in Table 3.
Table 3. Characteristics of the association between confounders in the mathematical model and the probability of patients failing to achieve target BP values after ACE inhibitor intake
| Mathematical confounders | Unadjusted data | Adjusted data | ||
|---|---|---|---|---|
| COR; 95% CI | p | AOR; 95% CI | p | |
| Number of polymorphic D alleles in the ACE I/D (rs1799752) genotype | 683.7; 34.18–13676.7 | <0.001* | 683.7; 34.18–13676.7 | <0.001* |
| Age, complete years | 0.8; 0.81–0.99 | 0.04* | 0.9; 0.81–0.99 | 0.04* |
Note: * – statistical significance (p <0.05).
Figure 3 shows the adjusted odds ratios with 95% CI for the studied factors included in the model.
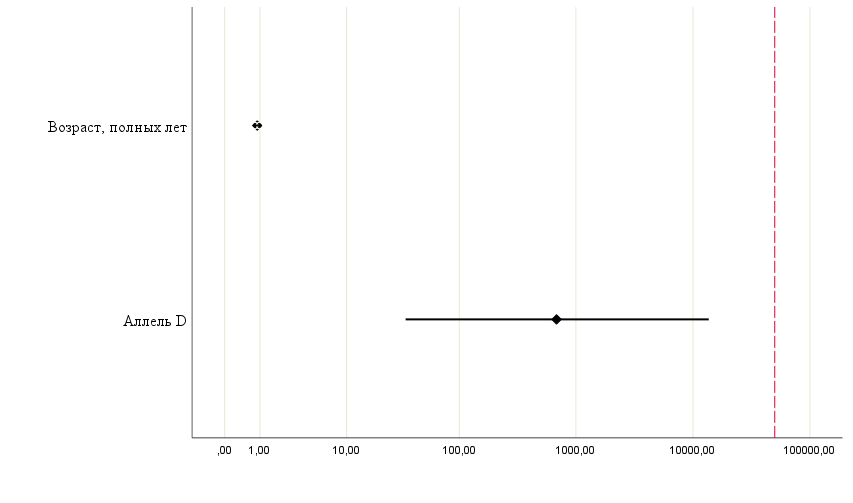
Fig. 3. OR diagram, 95% CI for the model identifying confounders influencing patients’ failure to achieve target BP values
The threshold probability for achieving an optimal response to antihypertensive therapy with ACEIs was set at P = 50%. At P >50%, a high rate of non‑achievement of target BP after ACEI intake was determined. At P <50%, a low risk of non‑achievement was observed. At this threshold, the sensitivity and specificity of the model were 98.0% and 89.7%, respectively. The diagnostic accuracy of the mathematical model was 92.4%.
To evaluate the diagnostic performance of the constructed model and determine the optimal classification threshold (cut‑off), ROC curve analysis was used.
The area under the ROC curve (AUC) for the relationship between confounders contributing to optimal antihypertensive response and the probability of outcome P was 0.97±0.013 with 95% CI: 0.95–1.0. The ROC curve is shown in Fig. 4.

Fig. 4. ROC curve of the model for predicting failure to achieve target BP values when taking ACE inhibitors
The probability threshold P(1) at the cut‑off point was 0.55. Values of P equal to or exceeding this value corresponded to a prediction of non‑achievement of target BP with ACEI use. The sensitivity and specificity at this cut‑off were again 98.0% and 89.7%, respectively.
Discussion
The results of this study confirm the multifactorial nature of the therapeutic response to ACEIs in hypertensive patients. In the studied sample, patients who achieved or did not achieve target BP were comparable in sex and BMI, yet they differed significantly in baseline and final SBP and DBP. Patients who did not reach target BP had higher initial BP values, which could have influenced the clinical efficacy indices of ACEI therapy and made it more difficult to achieve target control. Pharmacogenetic analysis revealed that the highest post‑treatment SBP and DBP values were observed in patients carrying the polymorphic D allele of the ACE I/D (rs1799752) gene, regardless of the CES1 (c.1168‑33C>A) genotype. This finding is consistent with data on the role of the ACE I/D (rs1799752) polymorphism in regulating RAAS activity and shaping individual drug responses [11–12]. However, these results should be interpreted cautiously as predictive associations because of the considerable inconsistency in large clinical trials [13]. Several published studies on the influence of the ACE I/D (rs1799752) polymorphism on antihypertensive therapy outcomes highlight high heterogeneity across populations, clinical endpoints, and study designs [13–15].
Regression analysis indicated a significant contribution of the ACE I/D (rs1799752) polymorphism to the variability of haemodynamic responses to ACEIs. In the linear models, an increased number of D alleles was associated with higher BP values after ACEI administration. Daily salt intake was a statistically significant modifiable factor, reinforcing the need for combined consideration of genetic and behavioural confounders for preliminary assessment of ACEI efficacy. In the binary logistic model, the number of D alleles of the ACE I/D (rs1799752) gene was directly associated with non‑achievement of target BP. This trend suggests that this non‑modifiable confounder could be considered a potential factor associated with suboptimal therapeutic response to ACEIs in the studied patient sample. The high adjusted odds ratios (COR) should not be regarded as a basis for independent clinical application of the model, since the model was built on a limited sample and has not undergone external validation.
The role of the CES1 (c.1168‑33C>A) gene became apparent in the analysis of combined pharmacogenetic variants of the ACE/CES1 genes, but it did not reach statistical significance in the regression analysis (p >0.05). This trend may be due to the predominant influence of the CES1 (c.1168‑33C>A) gene on the pharmacokinetic properties of specific ACEIs, whereas the present study examined the effect of various drugs from this class on the therapeutic outcome. The lack of contribution of the CES1 (c.1168‑33C>A) gene in the constructed models does not exclude its potential clinical relevance.
In cardiology research, mathematical modelling is used to evaluate factors associated with treatment outcomes, and the inclusion of pharmacogenetic parameters in such models is viewed as a promising tool for therapy personalisation [16–17]. The classic study by Reid JL and Meredith PA demonstrated that individual pharmacokinetic and pharmacodynamic characteristics directly affect the clinical effect and can be used as a mathematical model of pharmacodynamic response to antihypertensive therapy [18]. A recent study by Smith D and Layton A, using a compartmental mathematical model based on differential equations of the intrarenal RAAS influence on the pathogenesis of AH, proved that mathematical modelling is a valid tool for studying factors affecting antihypertensive therapy outcomes [19]. Similarly, a pharmacokinetic/pharmacodynamic mathematical model of ACE inhibition developed by Ford Versypt et al. showed that mathematical modelling can quantitatively describe the response to ACEI therapy, but requires the integration of numerous clinical, behavioural, and genetic factors [20].
Study limitations
This study had several limitations that hinder extrapolation of the results to larger patient populations. These include the single‑centre observational design, the small sample size (n=90), the restricted number of factors included in the mathematical models, and the lack of external validation of the developed models. A number of clinical factors that could have influenced the therapeutic response to ACEIs were not accounted for. An additional limitation is the heterogeneity in the use of different ACEI drugs. Given these limitations, the results of this study should be interpreted as preliminary and require confirmation in larger independent patient cohorts.
1. Unger T, Borghi C, Charchar F, et al. 2020 International Society of Hypertension Global Hypertension Practice Guidelines. Hypertension. 2020 Jun;75(6):1334-1357. Doi:10.1161/HYPERTENSIONAHA.120.15026.
2. Mancia G, Kreutz R, Brunström M, et al. 2023 ESH Guidelines for the management of arterial hypertension The Task Force for the management of arterial hypertension of the European Society of Hypertension: Endorsed by the International Society of Hypertension (ISH) and the European Renal Association (ERA). J Hypertens. 2023 Dec 1;41(12):1874-2071. Doi: 10.1097/HJH.0000000000003480. Epub 2023 Sep 26. Erratum in: J Hypertens. 2024 Jan 1;42(1):194. Doi: 10.1097/HJH.0000000000003621.
3. McEvoy JW, McCarthy CP, Bruno RM, et al; ESC Scientific Document Group. 2024 ESC Guidelines for the management of elevated blood pressure and hypertension. Eur Heart J. 2024 Oct 7;45(38):3912-4018. Doi: 10.1093/eurheartj/ehae178. Erratum in: Eur Heart J. 2025 Apr 7;46(14):1300. Doi: 10.1093/eurheartj/ehaf031. Erratum in: Eur Heart J. 2025 Dec 1;46(45):4949. Doi: 10.1093/eurheartj/ehaf659.
4. Rysz J, Franczyk B, Rysz-Górzyńska M, Gluba-Brzózka A. Pharmacogenomics of Hypertension Treatment. Int J Mol Sci. 2020 Jul 1;21 (13):4709. Doi: 10.3390/ijms21134709.
5. Flaten HK, Monte AA. The Pharmacogenomic and Metabolomic Predictors of ACE Inhibitor and Angiotensin II Receptor Blocker Effectiveness and Safety. Cardiovasc Drugs Ther. 2017 Aug;31(4):471-482. Doi: 10.1007/s10557-017-6733-2.
6. Rigat B, Hubert C, Alhenc-Gelas F, et al. An insertion/deletion polymorphism in the angiotensin I-converting enzyme gene accounting for half the variance of serum enzyme levels. J Clin Invest. 1990 Oct;86(4):1343-6. Doi: 10.1172/JCI114844.
7. Her LH, Wang X, Shi J, et al. Effect of CES1 genetic variation on enalapril steady-state pharmacokinetics and pharmacodynamics in healthy subjects. Br J Clin Pharmacol. 2021 Dec;87(12):4691-4700. Doi: 10.1111/bcp.14888.
8. IkonnikovaA, Kazakov R, Rodina T, et al. The Influence of Structural Variants of the CES1 Gene on the Pharmacokinetics of Enalapril, Presumably Due to Linkage Disequilibrium with the Intronic rs2244613. Genes (Basel). 2022 Nov 27;13(12):2225. Doi: 10.3390/genes13122225.
9. Ikonnikova A, Rodina T, Dmitriev A, et al. The Influence of the CES1 Genotype on the Pharmacokinetics of Enalapril in Patients with Arterial Hypertension. J Pers Med. 2022 Apr 5;12(4):580. Doi: 10.3390/jpm12040580.
10. Agostini LDC, Silva NNT, Belo VA, et al. Pharmacogenetics of angiotensin-converting enzyme inhibitors (ACEI) and angiotensin II receptor blockers (ARB) in cardiovascular diseases. Eur J Pharmacol. 2024 Oct 15;981:176907. Doi: 10.1016/j.ejphar.2024.176907.
11. Brugts JJ, Isaacs A, de Maat MP, et al. A pharmacogenetic analysis of determinants of hypertension and blood pressure response to angiotensin-converting enzyme inhibitor therapy in patients with vascular disease and healthy individuals. J Hypertens. 2011 Mar;29(3):509-19. Doi: 10.1097/HJH.0b013e328341d117.
12. Heidari F, Vasudevan R, Mohd Ali SZ, et al. Association of insertion/deletion polymorphism of angiotensin-converting enzyme gene among Malay male hypertensive subjects in response to ACE inhibitors. J Renin Angiotensin Aldosterone Syst. 2015 Dec;16(4):872-9. Doi: 10.1177/1470320314538878.
13. Scharplatz M, Puhan MA, Steurer J, et al. Does the Angiotensin-converting enzyme (ACE) gene insertion/deletion polymorphism modify the response to ACE inhibitor therapy?--A systematic review. Curr Control Trials Cardiovasc Med. 2005 Oct 24;6(1):16. Doi: 10.1186/1468-6708-6-16.
14. McNamara DM, Holubkov R, Janosko K, et al. Pharmacogenetic interactions between beta-blocker therapy and the angiotensin-converting enzyme deletion polymorphism in patients with congestive heart failure. Circulation. 2001 Mar 27;103(12):1644-8. Doi: 10.1161/01.cir.103.12.
15. Yu H, Zhang Y, Liu G. Relationship between polymorphism of the angiotensin-converting enzyme gene and the response to angiotensin-converting enzyme inhibition in hypertensive patients. Hypertens Res. 2003 Nov;26(11):881-6. Doi: 10.1291/hypres.26.881.
16. Milionis HJ, Kostapanos MS, Vakalis K, et al. Impact of renin-angiotensin-aldosterone system genes on the treatment response of patients with hypertension and metabolic syndrome. J Renin Angiotensin Aldosterone Syst. 2007 Dec;8(4):181-9. Doi: 10.3317/jraas.2007.027.
17. Kutumova E, Kiselev I, Sharipov R, et al. Mathematical modeling of antihypertensive therapy. Front Physiol. 2022 Dec 14;13:1070115. Doi: 10.3389/fphys.2022.1070115.
18. Reid JL, Meredith PA. Concentration-effect analysis of antihypertensive drug responses. Hypertension. 1990 Jul;16(1):12-8. Doi: 10.1161/01.hyp.16.1.12.
19. Smith D, Layton A. The intrarenal renin-angiotensin system in hypertension: insights from mathematical modelling. J Math Biol. 2023 Mar 23;86(4):58. Doi: 10.1007/s00285-023-01891-y.
20. Ashlee N, Ford Versypt, Grace K, et al. A pharmacokinetic/pharmacodynamic model of ACE inhibition of the renin-angiotensin system for normal and impaired renal function. Computers & Chemical Engineering. 2017; 104: 311- 322. Doi: 10.1016/j.compchemeng.2017.03.027.
Olga V. Komarova — Assistant of the Department of Pharmacology
Astrakhan
Bela I. Kantemirova — Dr. Sci. (Med.), Professor, Head of the Department of Pharmacology
Astrakhan
Aleksandra N. Romanova — assistant of the Department of Pharmacology
Astrakhan
Olga V. Petrova — Dr. Sci. (Med.), Professor, Head of Laboratory
Astrakhan
Komarova O.V., Kantemirova B.I., Romanova A.N., Petrova O.V. Pharmacogenetics and mathematical modeling: approaches to individual prediction of response to ACE inhibitor therapy. Pharmacogenetics and Pharmacogenomics. 2026;(2):12-23. (In Russ.) https://doi.org/10.37489/2588-0527-0007. EDN: YJAYFO
НАШИ КНИГИ




Другие журналы
"Издательства ОКИ"




ПАРТНЕРЫ


 Email this article (Login required)
Email the author (Login required)
Email this article (Login required)
Email the author (Login required)  Post a Comment (Login required)
121357, Moscow, st. Vatutina, 4, building 2, apt. 22
LLC "Izdatelstvo OKI"
Tel. + 7 (916) 986-04-65
Email: eva88@list.ru